Monitoring
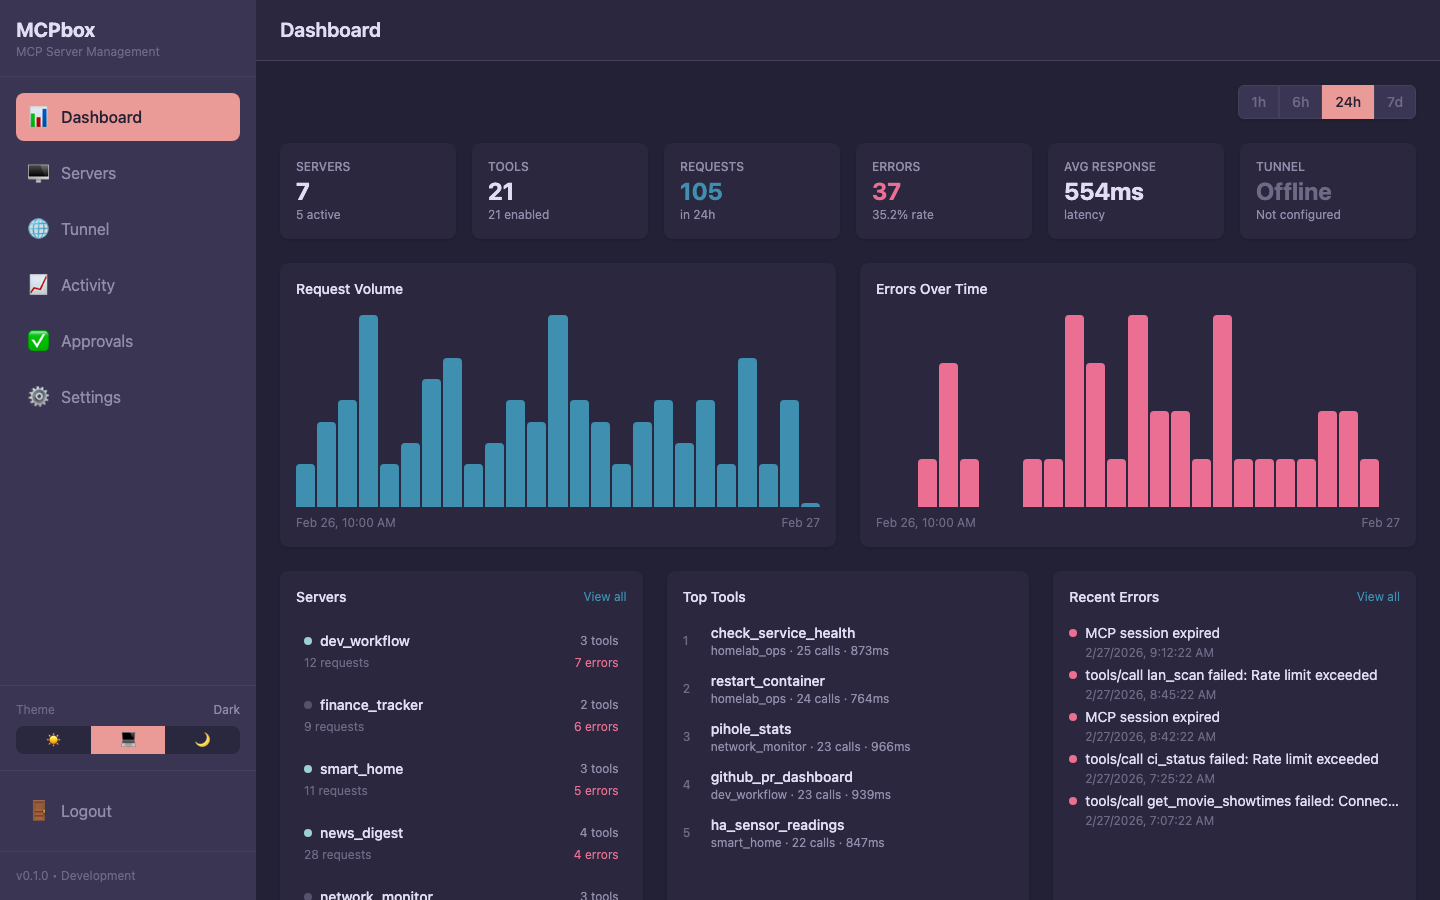
The MCPBox dashboard provides at-a-glance monitoring of your servers, tools, request volume, and error rates.
The Activity page provides detailed execution history and protocol logs for debugging.
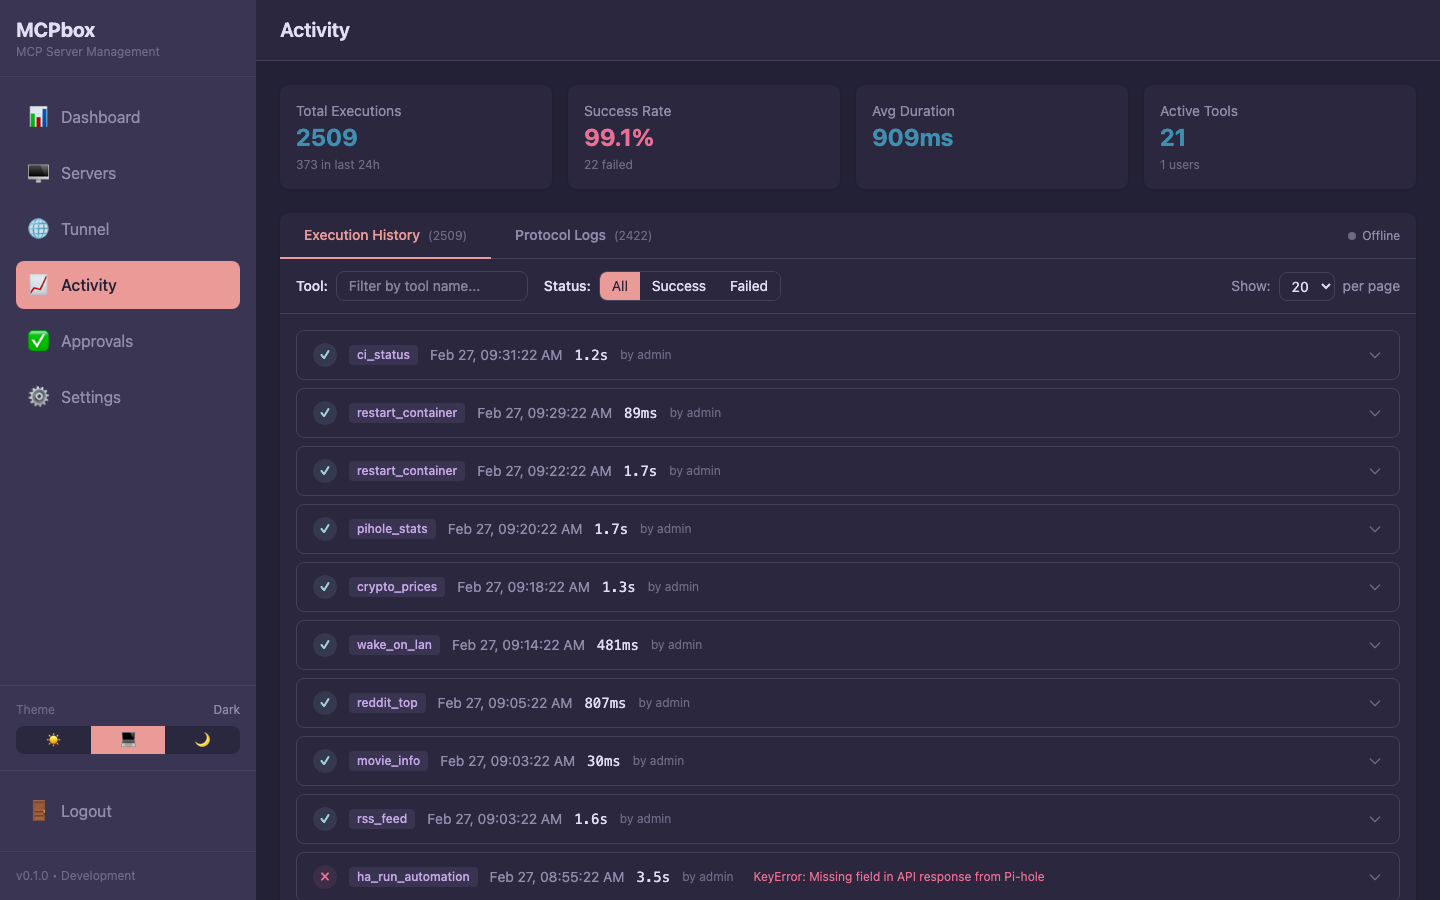 Execution history with success/failure status, duration, and tool name.
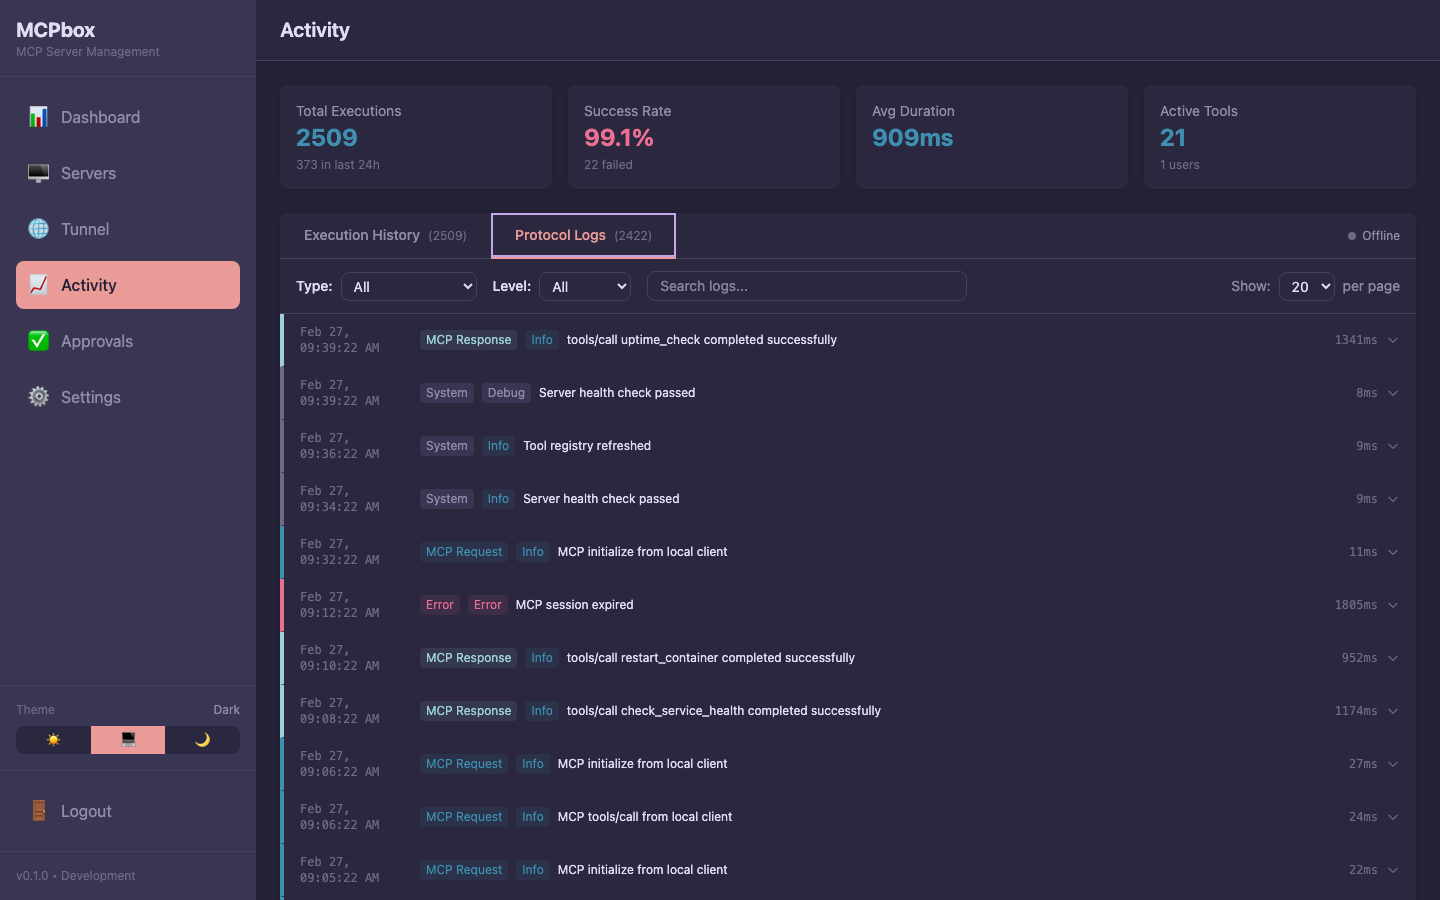 MCP protocol logs showing request types, levels, and messages.
Health Checks
MCPBox provides several health check endpoints:
# Basic health
curl http://localhost:8000/health
# → {"status": "healthy"}

# Detailed health with service status
curl http://localhost:8000/health/detail

# Individual service health
curl http://localhost:8000/health/services
The detailed health check reports the status of PostgreSQL, the sandbox, and circuit breakers.
Prometheus Metrics
MCPBox exposes a /metrics endpoint (enabled by default).
curl http://localhost:8000/metrics
Key metrics:
| Metric | Type | Description |
|---|---|---|
http_request_duration_seconds | Histogram | Request latency (p50, p95, p99) |
http_requests_total | Counter | Request count by method, handler, status |
http_request_size_bytes | Histogram | Request body sizes |
http_response_size_bytes | Histogram | Response body sizes |
To disable metrics, set ENABLE_METRICS=false in .env.
Webhook Alerting
Configure ALERT_WEBHOOK_URL in .env to receive critical alerts:
# Discord
ALERT_WEBHOOK_URL=https://discord.com/api/webhooks/your-webhook-id/your-token

# Slack
ALERT_WEBHOOK_URL=https://hooks.slack.com/services/your/webhook/url
Alerts fire on circuit breaker trips, security events, and other critical conditions.
Logs
MCPBox logs to stdout in structured JSON format.
# View all logs
docker compose logs -f

# View specific service
docker compose logs -f backend

# View last 100 lines
docker compose logs --tail=100 backend
Configure your Docker logging driver for retention:
# docker-compose.override.yml
services:
  backend:
    logging:
      driver: "json-file"
      options:
        max-size: "10m"
        max-file: "3"